


Navigators begin watching the Gulf Stream structure and evolution well before they cross the starting line and head for Bermuda. By Frank Bohlen
With slightly more than one month to go until the start of this year’s Newport Bermuda Race, it’s none too early for anyone involved in planning race strategies to start the study of the Gulf Stream in earnest. (Feel free to skip to full report.)
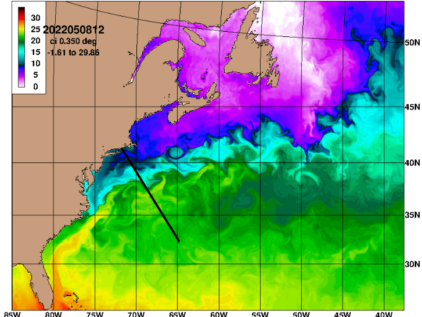
Recognizing that the Gulf Stream is typically a well-defined boundary current between the warm waters of the Sargasso Sea surrounding Bermuda and the cooler waters off the east coast of the United States it’s logical to begin study by examining data detailing sea surface temperatures in the vicinity of the rhumb line. A number of web sites can be used to obtain these data (see links listing on Bermudarace.com). I typically start with a review of the sea surface temperature (SST) satellite images at ( http://rucool.marine.rutgers.edu/ ), a site maintained by Rutgers University. This site provides both instantaneous SST images and daily composites allowing analysis of Stream characteristics during periods of moderate cloud cover.
Comparisons of the two types indicates that compositing (typically a daily average of conditions but sometimes longer) does degrade accuracy slightly but the loss is generally small since the structure of the Stream seldom changes significantly over the averaging period. Still, care is recommended in the interpretation of composite images. The Rutgers site also provides an archive of past satellite images useful in the study of changes in Stream position or structure.
For more, including the evolution of the Stream form and structure since February through mid-May, read the full report.