In 2019, the Bermuda Race Organizing Committee commissioned an analysis to review and propose revisions to the wind matrix used to score the Newport Bermuda Race. Jim Teeters led the project and explains the recommendations, which should level out the playing field for racing in lighter winds.
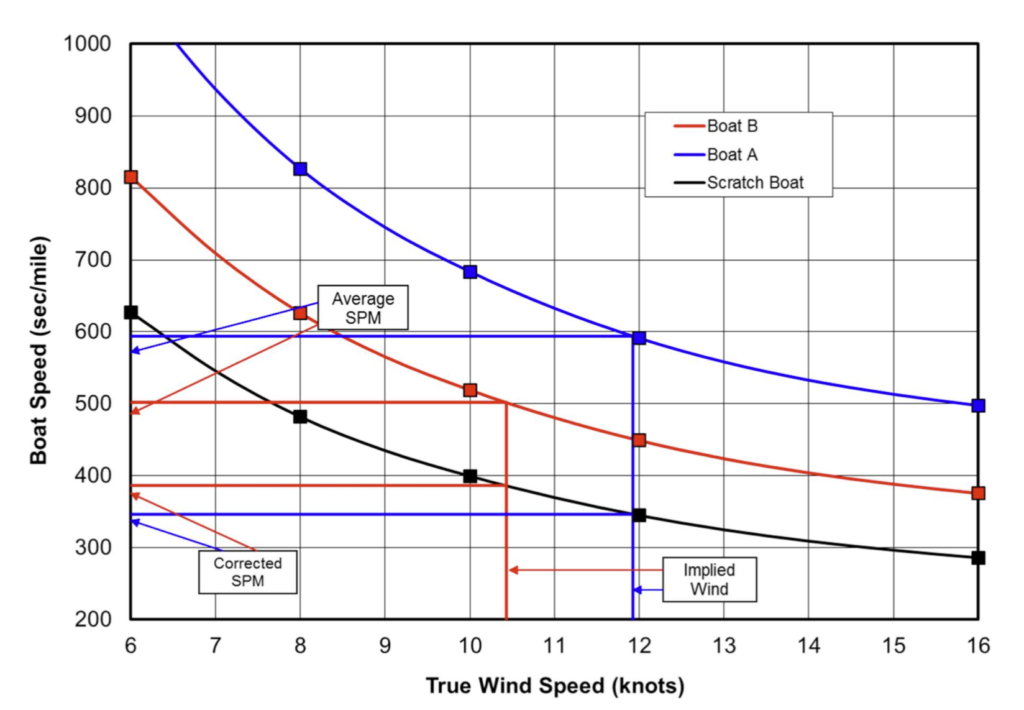
The Newport Bermuda Race has been handicapped for many years using Offshore Racing Rule (ORR) ratings and scored with a system called Performance Curve Scoring (PCS), which automatically calculates the corrected time for each boat. (For more on ORR and PCS, read “Bermuda Race FAQs: The ORR.”)
PCS uses a curve that fits handicaps at the seven wind speeds employed by the ORR—6, 8, 10, 12, 16, 20, 24 knots. For each wind speed, a blend of Velocity Prediction Program (VPP) speed predictions are used for a set of assumed wind angles. The wind-angle mixes used are different for each wind speed, reflecting assumptions about what happens on the racecourse during slow, intermediate and fast races.
The intent of the 2019 study by the Bermuda Race Organizing Committee (BROC) was to check the validity of those wind-angle assumptions.
The key elements of the analysis were as follows:
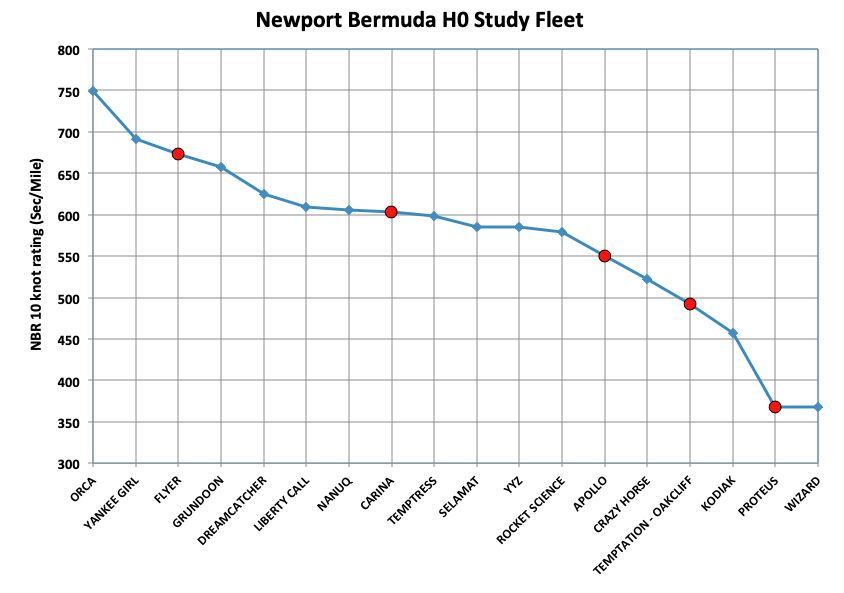
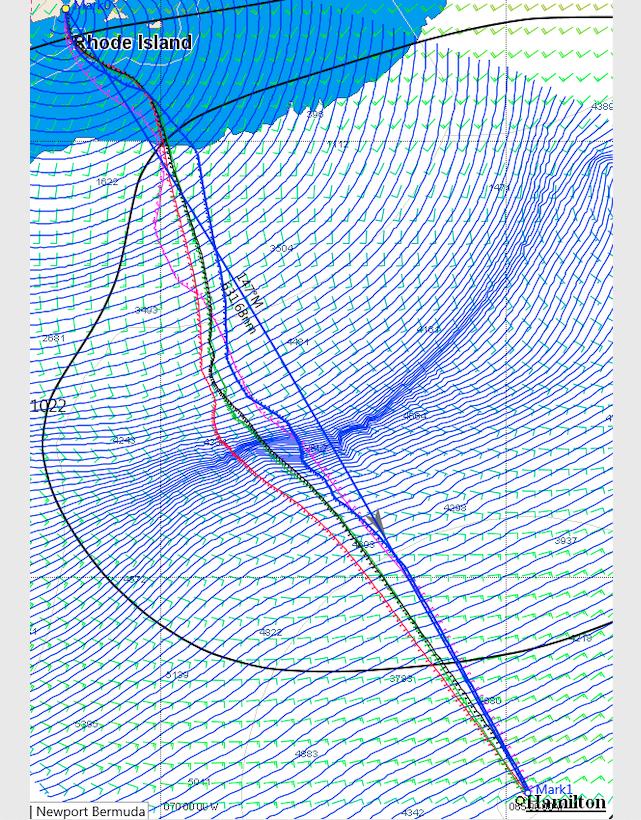
- Create a small fleet of boats representing the Newport Bermuda Race fleet and run it through optimal routing using GRB (Gridded Binary) wind files recorded for the last 15 years. Five boats were “sailed” to Bermuda for five June start dates in each year to generate a total of 375 optimal routes.
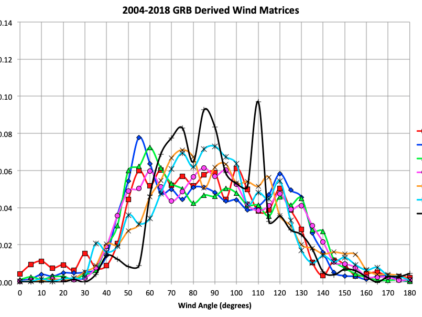
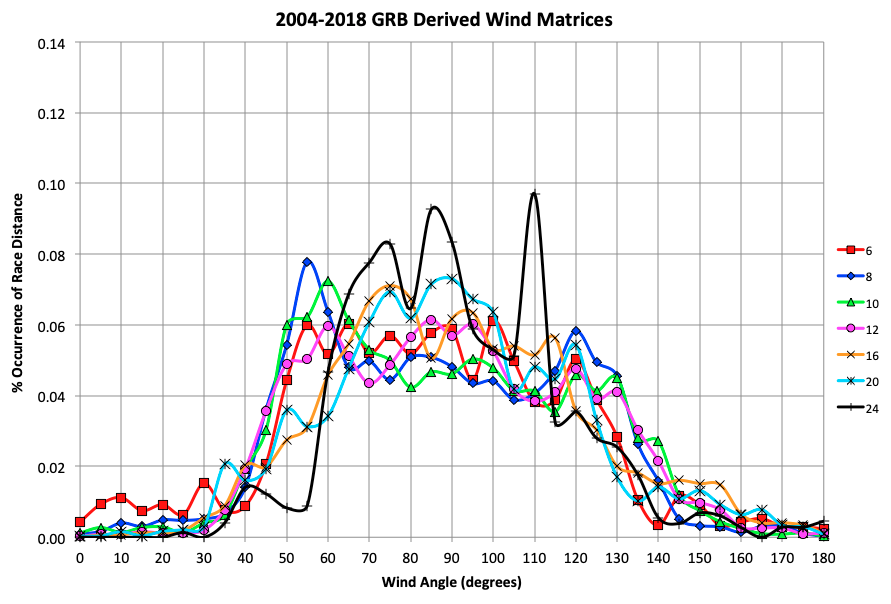
- For each route, the frequency of occurrence for each combination of wind speed and wind angle was recorded. For each boat, this generated a graph of the percent of race distance sailed at each wind angle (5 degree increments) from dead upwind to dead downwind, and for each of the seven ORR wind speeds.
- These curves were very similar for each wind speed and for each boat. The data for all five boats at all seven wind speeds was combined into a single curve of probabilities to be used in the ORR VPP. Of particular interest, this curve showed very little time spent sailing dead upwind or dead downwind.
- Also, a not surprising finding was that the fleet can spend considerable time sailing in very low wind speeds—less than 6 knots, which is the lowest wind used by PCS. The GRB files confirmed the existence of numerous periods in recent races where some or most boats were virtually becalmed.
- To represent this in Newport Bermuda Race scoring, the lighter-wind ratings were redefined to include the assumption of sailing in little or no wind.
- A number of races were re-scored using handicaps derived from the modified wind matrix.
The conclusions from this analysis:
- The wind-angle distribution does not change significantly with wind speed, unlike current assumptions.
- The current assumption of mostly windward/leeward sailing in the low-wind ratings used by PCS in slow races is incorrect. It is rare that boats sail equal distances on port and starboard tacks or jibes, and while there are periods where the boats are hard on the wind, they are generally pointed to where they want to go and seldom need to tack. This is much faster than sailing dead upwind or downwind.
- In previous years this has created a bias favoring boats that do not perform well sailing upwind and downwind in lighter conditions.
- Adopting a modified matrix of wind strengths and course mix to remove this bias should help to make lighter-wind races fairer.
None of this can address the reality that environmental conditions, including building or dying winds, frontal passages, or new weather patterns over the period of the race can greatly affect who does well and who does not, depending on the location of individual boats or classes of boats relative to weather patterns.
The only way to realistically model the impact of those factors on the outcome of racing is to do post-race scoring using the actual wind conditions experienced across the racecourse over the period of the race. This would lead to uncertainty and delays in the scoring of races, and may not be desirable from either a practical or philosophical perspective.
Therefore, for 2020, the BROC has chosen to modify its wind-strength assumptions and course mix for handicapping the Newport Bermuda Race to more accurately reflect recent historical wind patterns as demonstrated by this study.
Jim Teeters is the Technical Director of the Offshore Racing Rule, which is owned and managed by the Offshore Racing Association.