


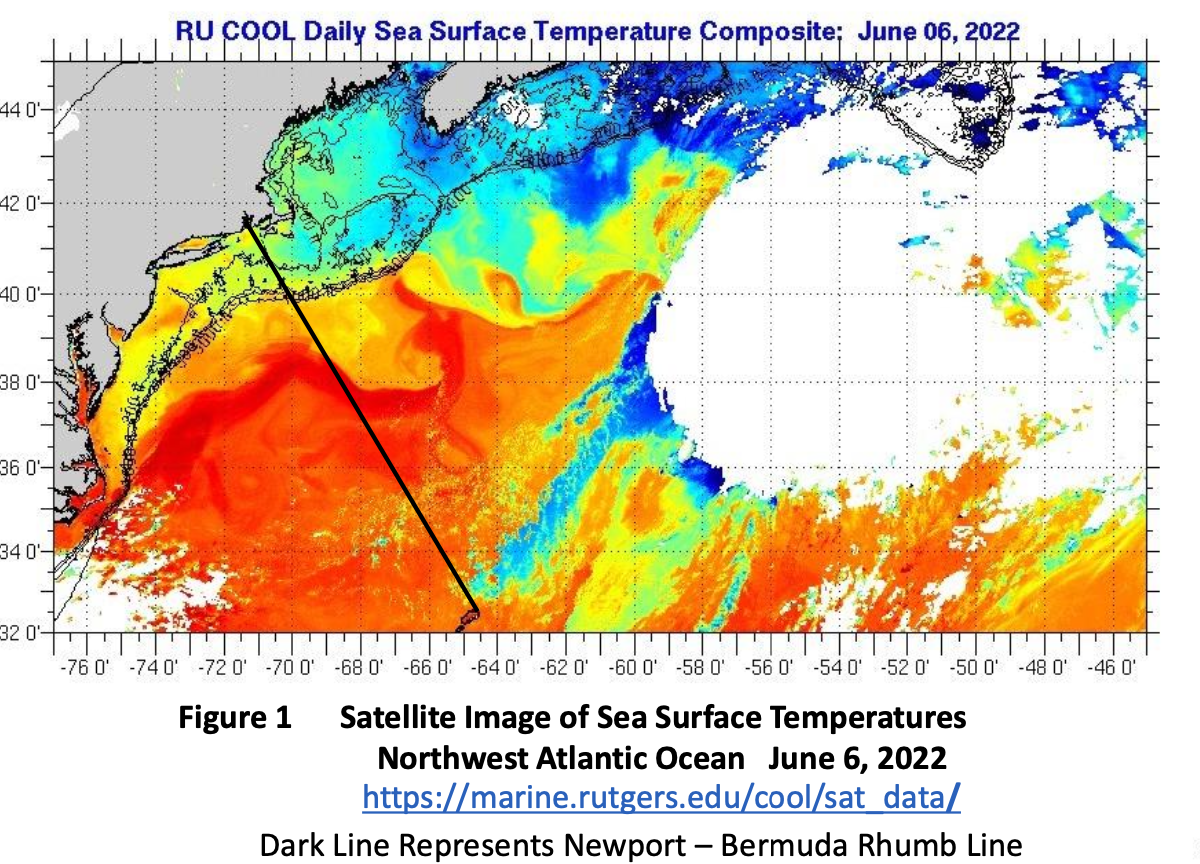
My analysis of Gulf Stream conditions since the 3rd of June has been made difficult by the prevalence of clouds over the Stream. (See "Gulf Stream Analysis Near Rhumb Line, June 3".) The composite of 6 June (Figure 1) was the last view until today when a partial image was obtained (Fig. 2).
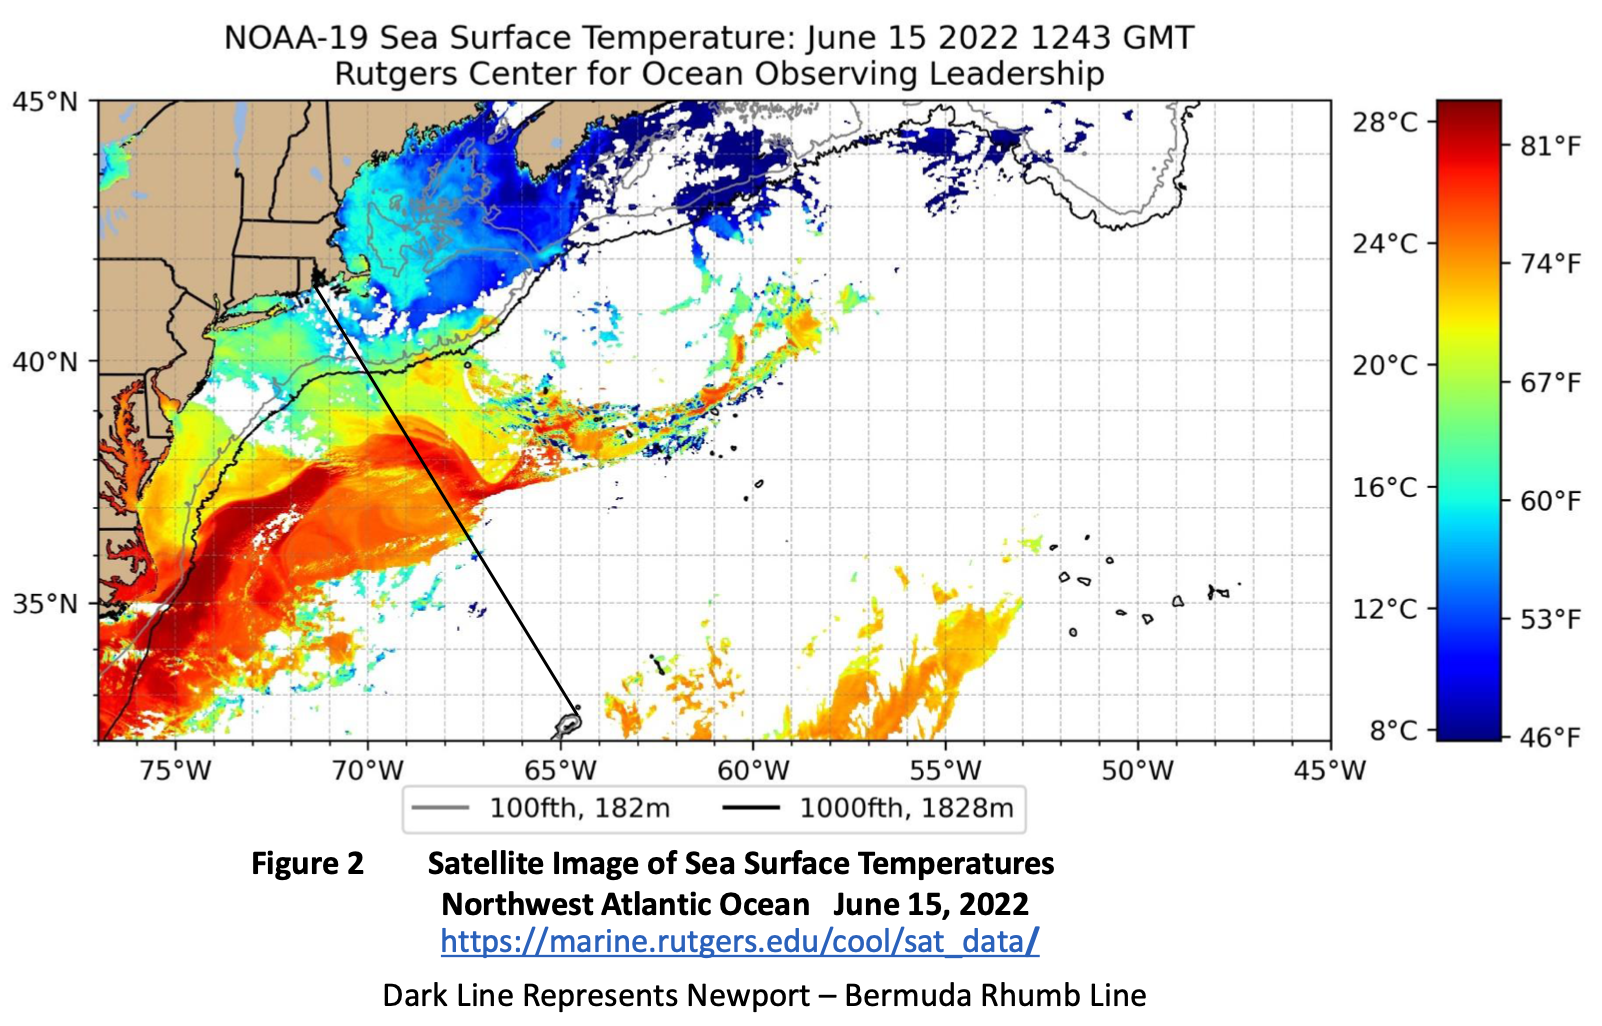
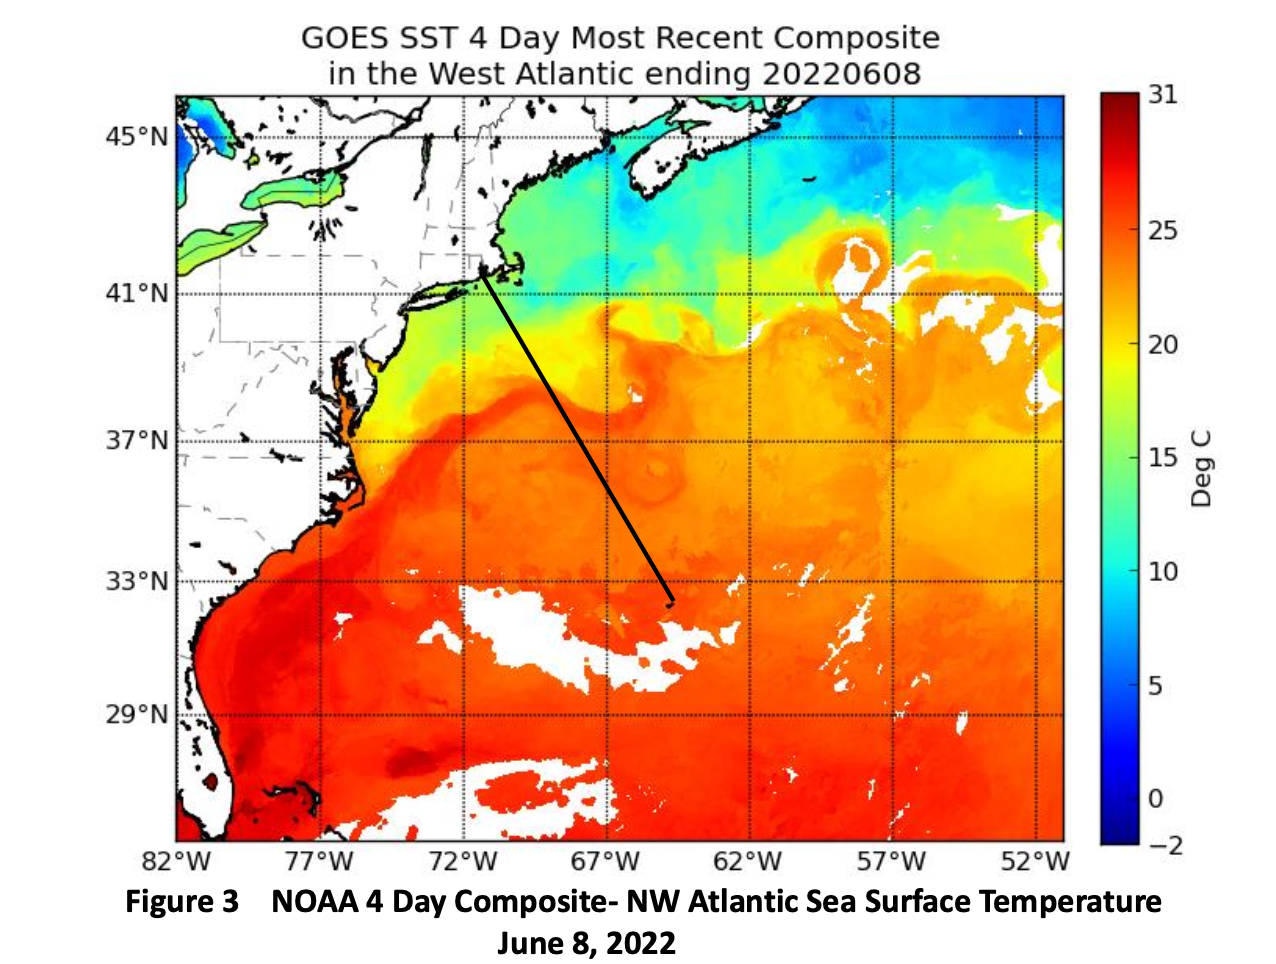
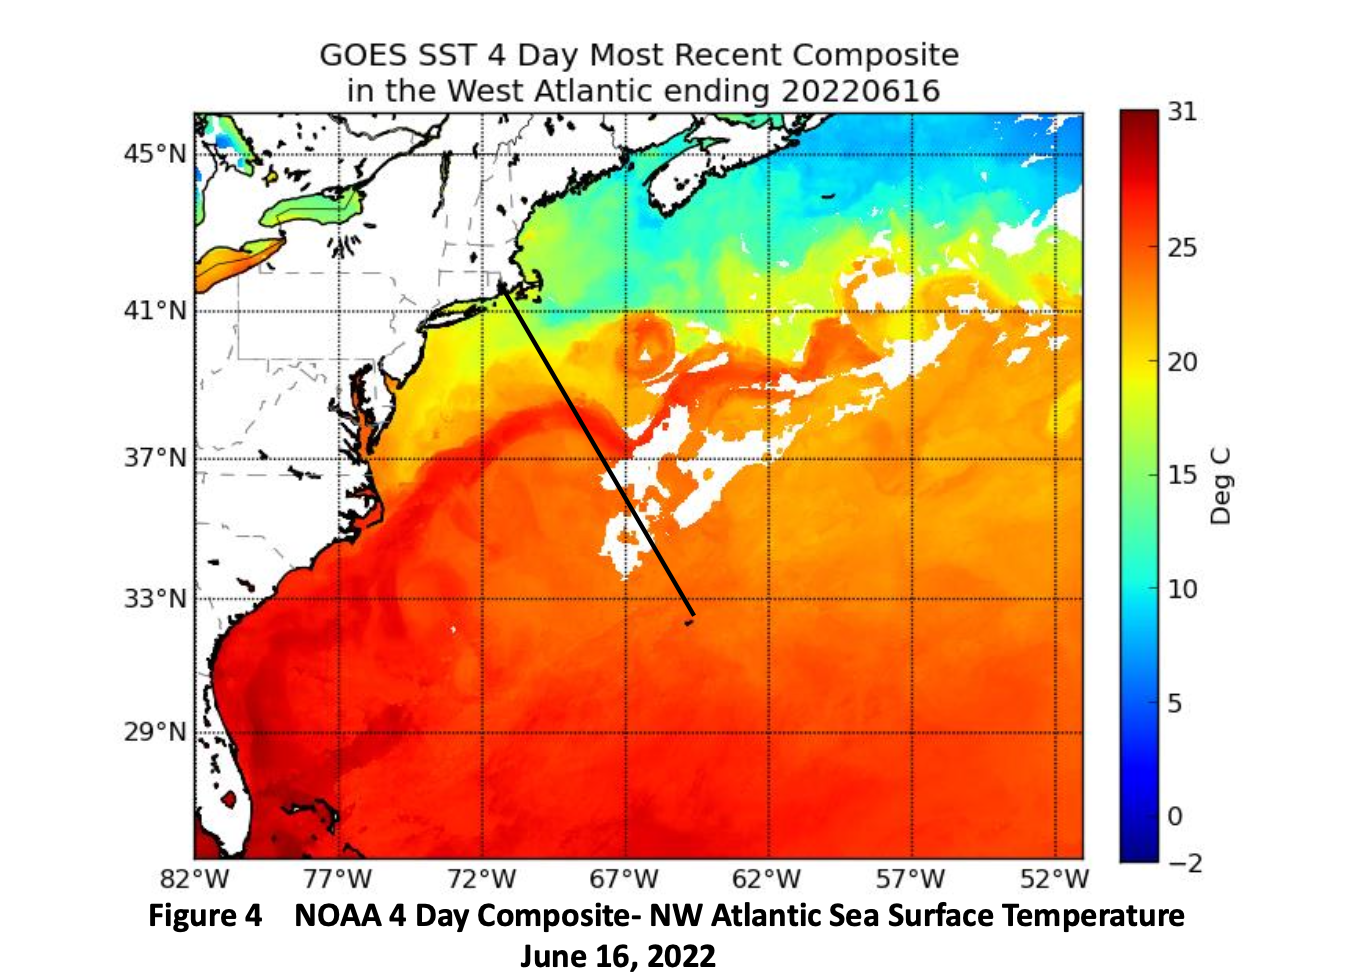
Comparison of theses image shows a clear easterly migration of the western limb of the meander and an associated deepening of the meander trough. The NOAA four-day composites show a similar pattern (Figs.3-4). It’s important to realize that this is the first reasonably progressive meander easterly migration observed for quite some time. The fact that the trough is also changing form suggests that the migration is like to slow or stop.
The altimetry-based model also shows some easterly migration of the meander and provides more detail on the structure of the main body of the Stream and associated warm and cold core rings (Figs. 5-6). All indications are that the north wall of Stream crosses the rhumb line near 38o 30’ 69o W flowing west to east. After crossing, the current almost immediately turns sharply to the south to southeast to the east of the rhumb line. To the west of the rhumb line, the flows are a bit more southerly (Fig. 6).
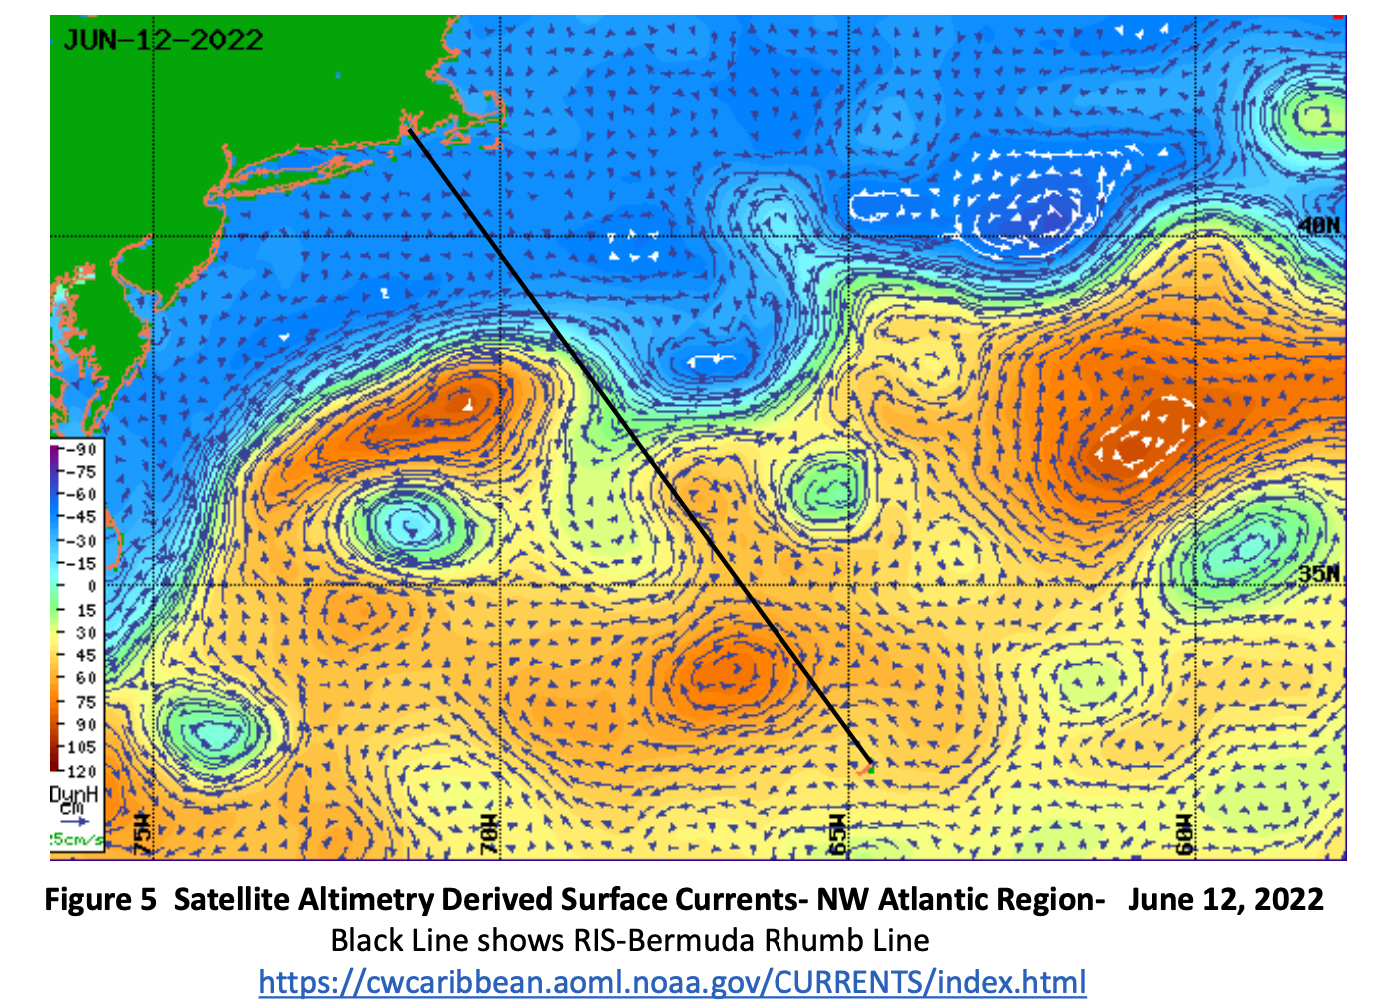
To the south of the main body of the Stream, the altimetry-based model shows two counterclockwise rotating features one east and one west of the rhumb line. The westerly feature has developed over the past few weeks as a product of the circulation associated with the meander. It is expected to drift slowly to the west. The easterly feature has over the past two weeks moved slightly to the west and in combination with the ring west of the rhumb line contributed to the development of an omega shaped flow pattern crossing the rhumb line near 36o 30’ N.
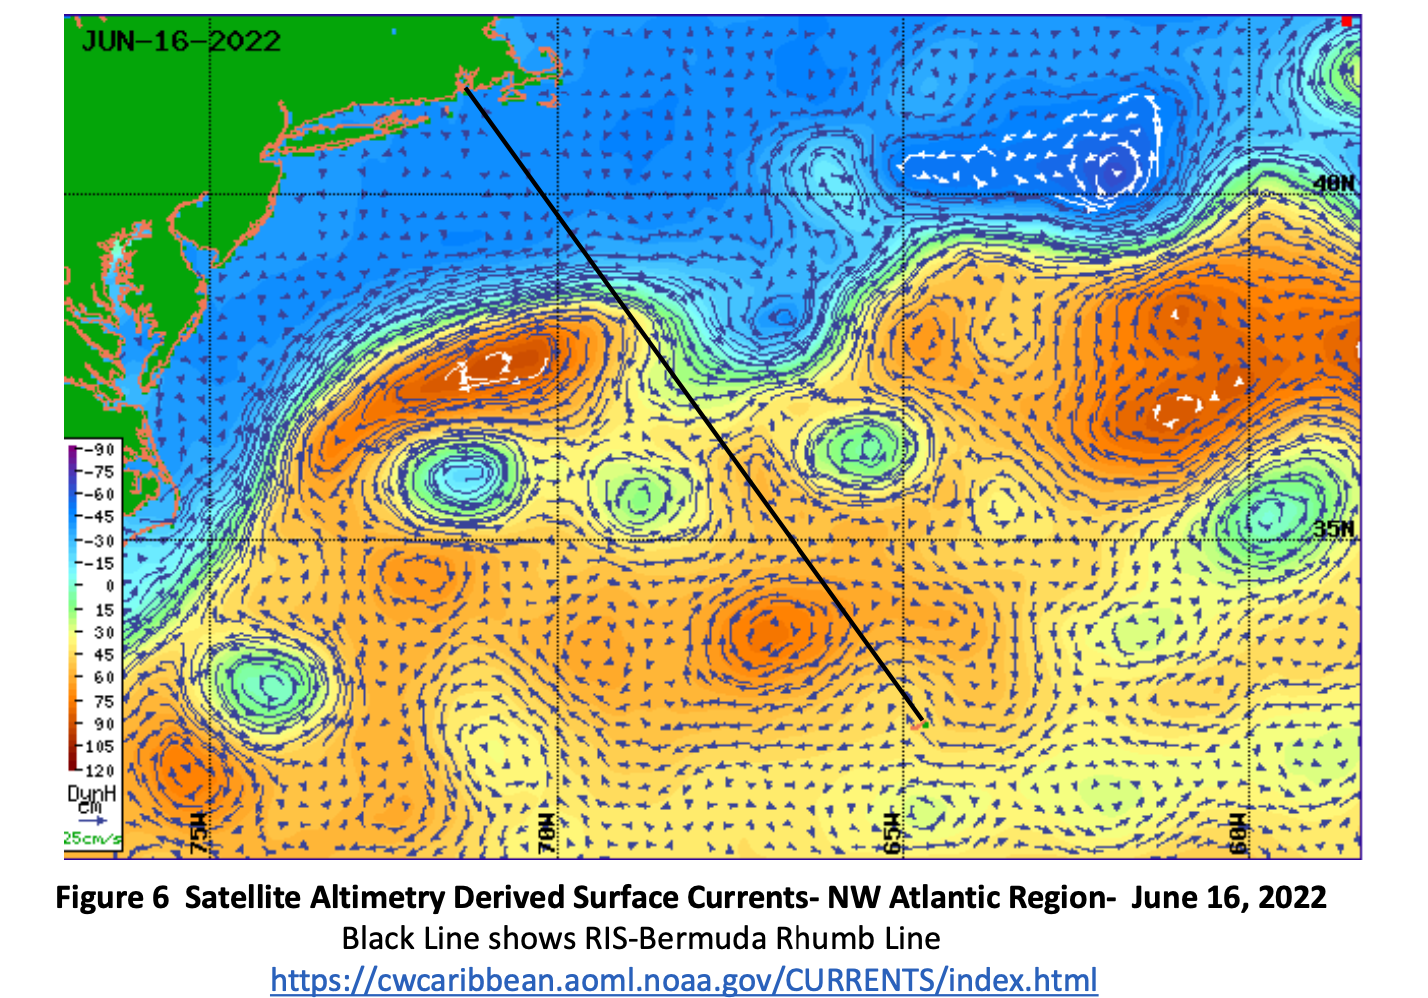
To the south of 35o N the altimetry based model shows a large clockwise rotating feature west of the rhumb line centered near 33o 30’ N 67o W. This feature affects 60 to 90nm of the rhumb line on approach to Bermuda (Figure 6).
Over the past month, the variety of numerical models of the Gulf Stream, some of which are regularly used in routing routines, have on several occasions displayed very different scenarios. The reason for this difference is not immediately apparent due to the complexity of the models and differing input data. Navigators using these models are advised to regularly compare model results to direct observations such as the Rutgers satellite IR sea surface temperature data as a check on model accuracy.


")


